TSPSafetyNet, Inc. has licensed the “Rapid Response” program from Michael Hartmann since December 31, 2015.
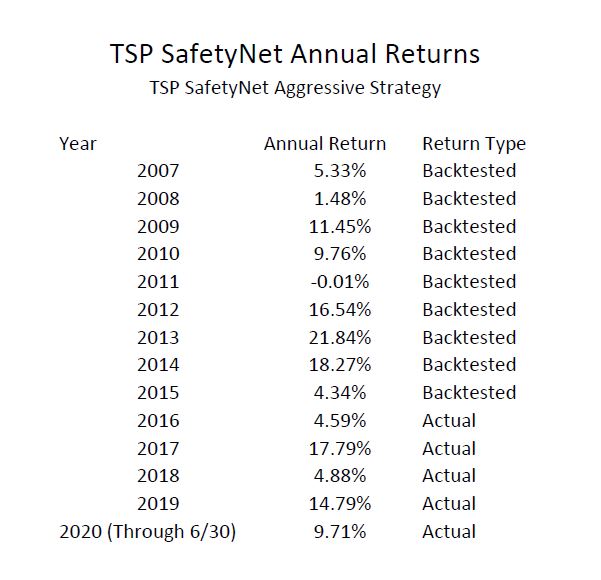
The numbers shown in the Performance section of this website represent the ACTUAL results of DOCUMENTED recommendations, the actual returns since 12/31/2015. Any numbers shown prior to that date are back tested. (See back test disclosure below) We are quite proud of the ACTUAL performance we have delivered to our subscribers who have benefited to the tune of millions of additional dollars in their accounts, and countless sleepless nights successfully avoided!
In the 4 full and 1 partial year since then NONE of the TSPSafetyNet allocation models have never suffered a negative year, unlike the broad stock markets which had a serious decline in 2018 and is experiencing severe difficulty in 2020; as a matter of fact our models had positive returns in those years also.
Longer term performance TSP SafetyNet Aggressive Strategy against an index of equal weighted returns of C, S, and I fund
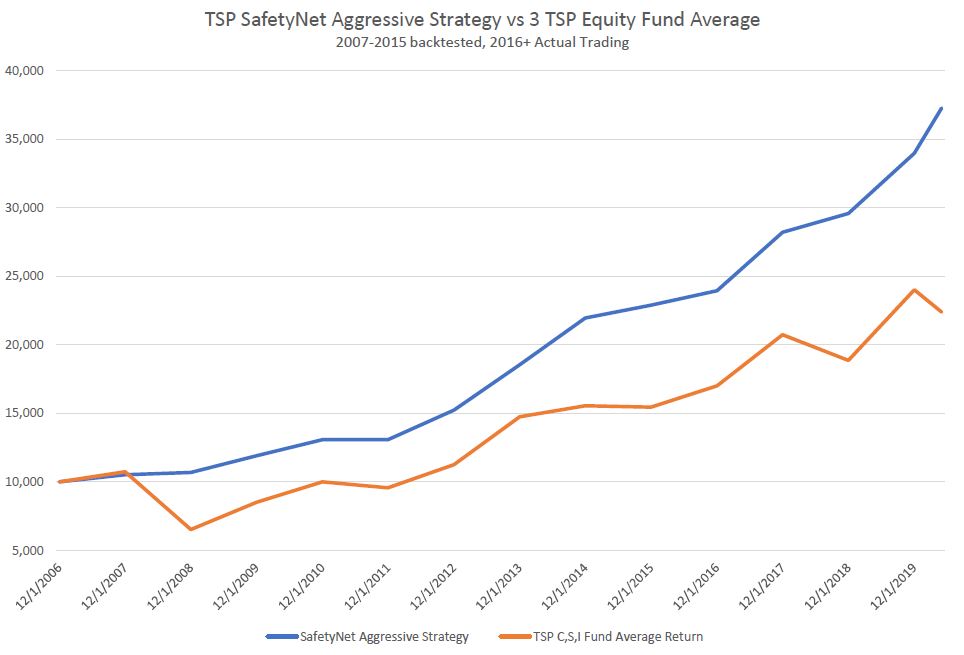
ACTUAL PERFORMANCE VS. TSP FUNDS
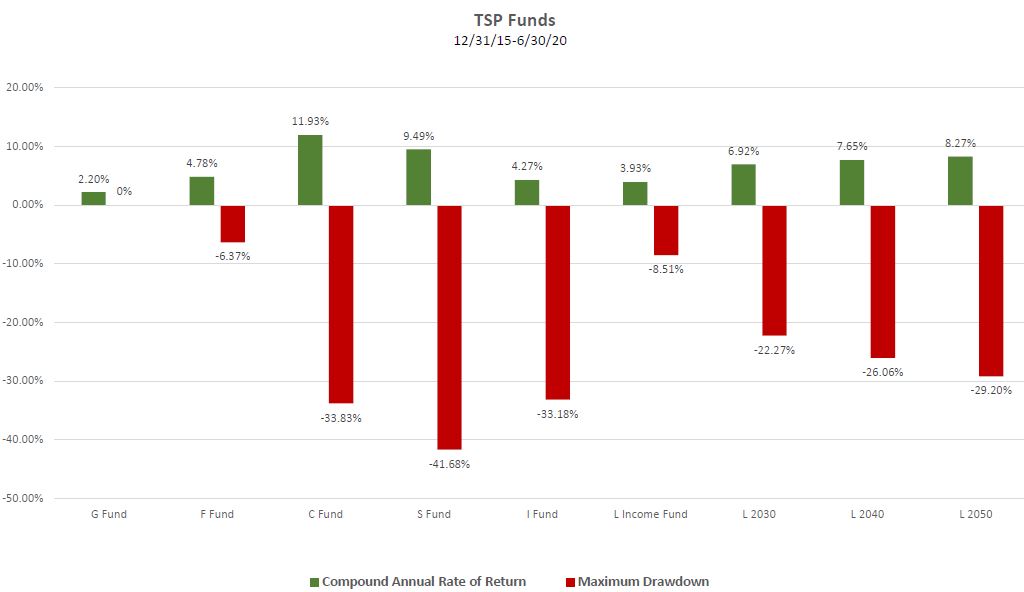
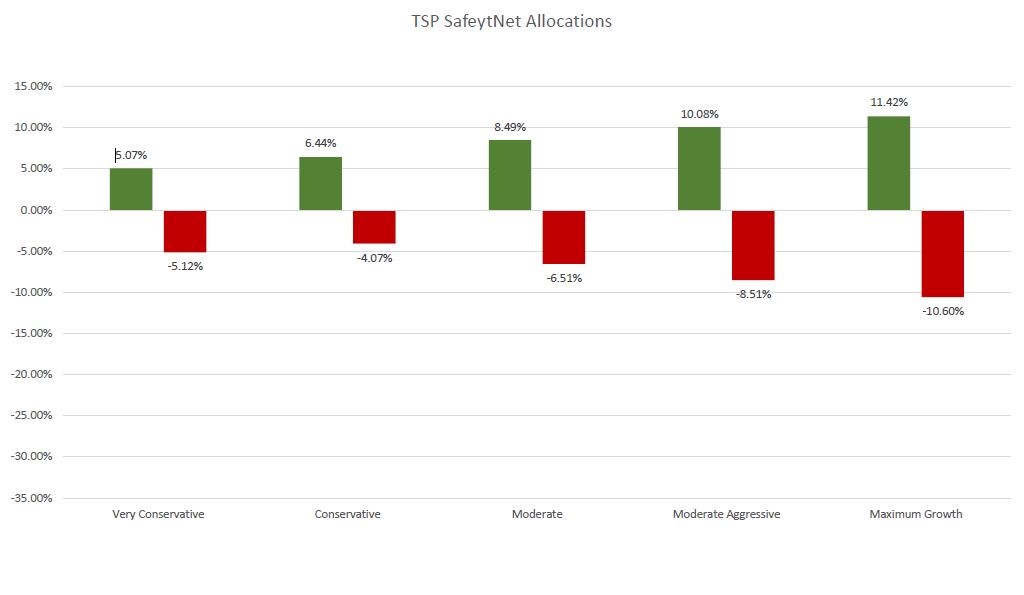
Please review the graphs, and associated risk and reward information for each of the models. You will notice our models have provided substantially higher rates of returns, while at the same time reducing risk by 50% or more. We measure risk as “draw down” to the account. Draw down is defined as the singles largest percentage drop from a point in time to the subsequently lowest level. Low draw down means much less fear and worry, and usually results in greater long term investment performance.
Back testing Disclosure
There are certain limitations inherent in hypothetical model results like those portrayed, particularly that such hypothetical model returns do not reflect trading in actual client accounts and do not reflect the impact that material economic and market factors may have had on the adviser’s decision-making had the adviser actually been managing client funds. Unlike an actual performance record, hypothetical back-tested performance results do not represent actual trading. These types of simulated trading programs, in general, benefit compared to actual performance results because such simulated programs are designed with the benefit of hindsight. In addition, simulated trading does not involve or take into account financial risk and does not take into account that material and market factors may have impacted IFA’s decision making, all of which can adversely affect actual trading results and performance. For example, the ability to withstand losses or adhere to a particular trading program in spite of trading losses are material points which can also adversely affect markets in general or the implementation of any specific trading program. Hypothetical back-tested performance does not represent actual performance, trading costs or the impact of taxes and should not be interpreted as an indication of such performance.
Recent Comments